Fig. 4
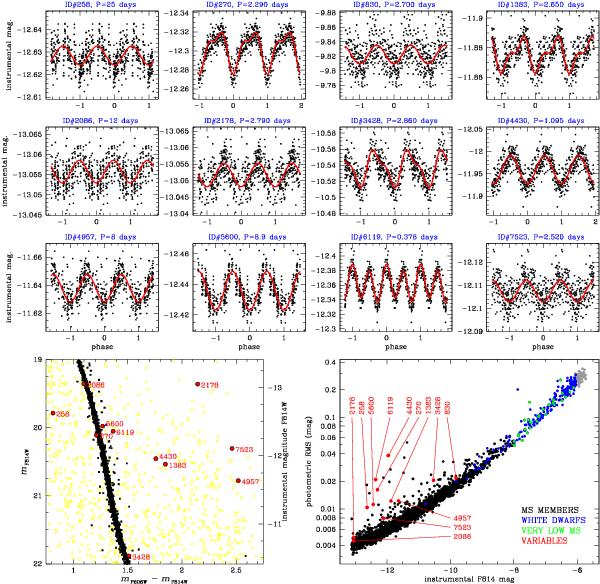
Top panels: light curves of the variable stars found (first twelve entries in Table 1), folded around the best-fit period. Bottom left panel: position of the variables (red IDs) in the (mF606W − mF814W, mF814W) color–magnitude diagram. Bottom right panel: photometric rms of the variables (red IDs) compared with all the analyzed light curves.
Current usage metrics show cumulative count of Article Views (full-text article views including HTML views, PDF and ePub downloads, according to the available data) and Abstracts Views on Vision4Press platform.
Data correspond to usage on the plateform after 2015. The current usage metrics is available 48-96 hours after online publication and is updated daily on week days.
Initial download of the metrics may take a while.