Fig. 5
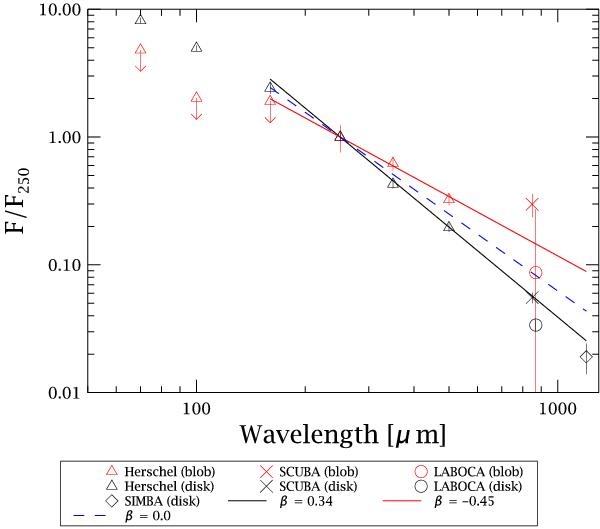
Spectral energy distribution of the debris disk (in black) and the blob (in red), normalised to their repective flux at 250 μm. The Herschel fluxes of the disk were obtained by integrating over a target radius of 60″, the SPIRE fluxes of the blob by integrating over a target radius of 20″. The PACS fluxes of the blob are upper limits, determined as described in Sect. 3. Additional flux points for the disk were taken from Holland et al. (1998) (SCUBA: 850 μm), Nilsson et al. (2009) (LABOCA: 870 μm) and Liseau et al. (2003) (SIMBA: 1.2 mm). The SCUBA and SIMBA fluxes were integrated over a 40″ radius aperture while the LABOCA flux point was obtained by fitting a Gaussian to the disk. Additional flux points for the blob were taken from Dent et al. (2000) (SCUBA: 850 μm) and Nilsson et al. (2009) (LABOCA: 870 μm). Overplotted are three modified Rayleigh-Jeans laws (Fν ∝ νβ + 2). The spectral indices have been determined using the fluxes at wavelengths λ ≥ 160 μm for the disk and λ ≥ 250 μm for the blob, with the inverse of the errors on the fluxes used as weight. Note the large error bar for the 870 μm flux point of the blob. The β = 0 curve is shown for comparison.
Current usage metrics show cumulative count of Article Views (full-text article views including HTML views, PDF and ePub downloads, according to the available data) and Abstracts Views on Vision4Press platform.
Data correspond to usage on the plateform after 2015. The current usage metrics is available 48-96 hours after online publication and is updated daily on week days.
Initial download of the metrics may take a while.