Fig. 1
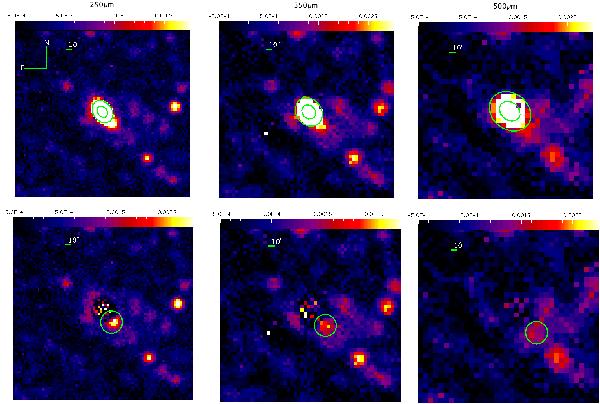
Surface brightness maps in the SPIRE bands (in the upper panels) with the fitted Gaussian overplotted; and the maps after subtraction of the fitted disk, with the position of the blob indicated with a 20″ radius circle in the lower panels (left: 250 μm; middle: 350 μm; right: 500 μm). All maps display the same area on the sky and are centred on the optical position of β Pic.
Current usage metrics show cumulative count of Article Views (full-text article views including HTML views, PDF and ePub downloads, according to the available data) and Abstracts Views on Vision4Press platform.
Data correspond to usage on the plateform after 2015. The current usage metrics is available 48-96 hours after online publication and is updated daily on week days.
Initial download of the metrics may take a while.