Fig. 3
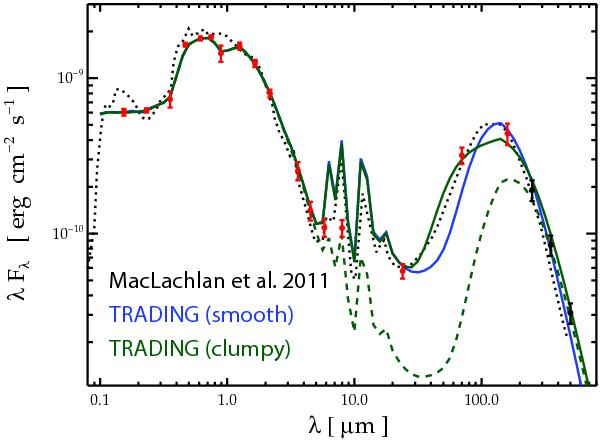
The spectral energy distribution of NGC 4244. The Herschel/SPIRE fluxes from this work (black points) are show together with literature data (red symbols, Dale et al. 2009; MacLachlan et al. 2011). We show the smooth model (blue line); the clumpy model with and without embedded stellar emission (solid and dashed green line, respectively), and the model from MacLachlan et al. (black dotted line).
Current usage metrics show cumulative count of Article Views (full-text article views including HTML views, PDF and ePub downloads, according to the available data) and Abstracts Views on Vision4Press platform.
Data correspond to usage on the plateform after 2015. The current usage metrics is available 48-96 hours after online publication and is updated daily on week days.
Initial download of the metrics may take a while.