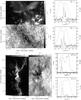
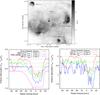
Fig. 6

Sample RA–v (left) and v–Dec (right) maps to demonstrate that the apparently very complex and chaotic appearance in the zeroth and first moment maps shown in Figs. 2 to 5 can easily be resolved in the third dimension. The two top panels represent an area where all three layers of 12CO3–2 emission (see text) that we found in the pathfinder are visible, the centre panels were taken towards DR 21, and the bottom panels towards W 75 N.
Current usage metrics show cumulative count of Article Views (full-text article views including HTML views, PDF and ePub downloads, according to the available data) and Abstracts Views on Vision4Press platform.
Data correspond to usage on the plateform after 2015. The current usage metrics is available 48-96 hours after online publication and is updated daily on week days.
Initial download of the metrics may take a while.