Fig. 3
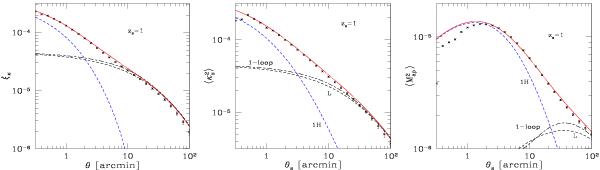
Convergence two-point correlation function (left panel), smoothed convergence (middle panel), and aperture-mass (right panel) for sources at redshift zs = 1. The points are the results from numerical simulations with 3 − σ error bars. The low black dashed line “L” is the linear prediction, the middle black dash-dotted line “1-loop” is the two-halo contribution, for which we used a perturbative resummation that is complete up to one-loop order, the upper blue dashed line “1H” is the one-halo contribution, and the red solid line is our full model, as in Fig. 1.
Current usage metrics show cumulative count of Article Views (full-text article views including HTML views, PDF and ePub downloads, according to the available data) and Abstracts Views on Vision4Press platform.
Data correspond to usage on the plateform after 2015. The current usage metrics is available 48-96 hours after online publication and is updated daily on week days.
Initial download of the metrics may take a while.