Fig. 7
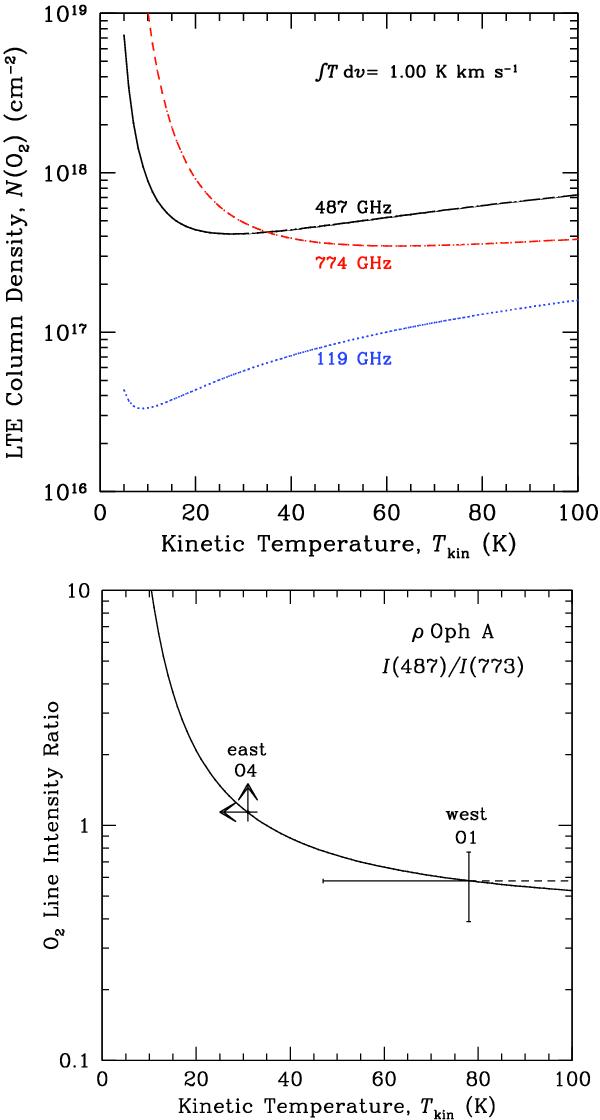
Upper: LTE computations of the O2 column density N(O2) as a function of the temperature T for an extended homogeneous source, to yield a line intensity of 1.0 K km s-1. For optically thin emission, intensity and column density are linearly related. 119 GHz: blue dots; 487 Ghz: black solid line; 774 GHz: red short dashes. Lower: the ratio of the 487 GHz integrated line intensity to that at 774 GHz is shown by the curve for a range of temperatures. For O1 (=O1 2), the error shown by the dashed line formally extends to the unplausible result of nearly 103 K. For O4, the limit symbols are for the lower limit on the intensity ratio and the upper limit on the temperature, respectively.
Current usage metrics show cumulative count of Article Views (full-text article views including HTML views, PDF and ePub downloads, according to the available data) and Abstracts Views on Vision4Press platform.
Data correspond to usage on the plateform after 2015. The current usage metrics is available 48-96 hours after online publication and is updated daily on week days.
Initial download of the metrics may take a while.