Fig. 5
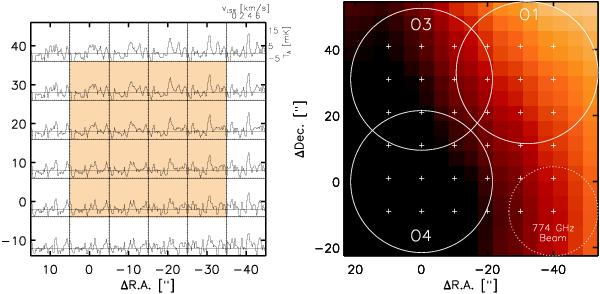
Left: the regridded 6 × 6 map of the WBS 774 GHz spectra, weighted by the Gaussian profile of the 487 GHz beam of 44′′. The darker area shows roughly the region within the half power beam width (HPBW). The υLSR and TA scales are indicated in the upper right corner. Right: same as left panel but as an image of the spatial distribution of the integrated intensity,  , with observed positions shown as pluses. The circles show the 487 GHz and 774 GHz beams, respectively.
Current usage metrics show cumulative count of Article Views (full-text article views including HTML views, PDF and ePub downloads, according to the available data) and Abstracts Views on Vision4Press platform.
Data correspond to usage on the plateform after 2015. The current usage metrics is available 48-96 hours after online publication and is updated daily on week days.
Initial download of the metrics may take a while.