Fig. 2
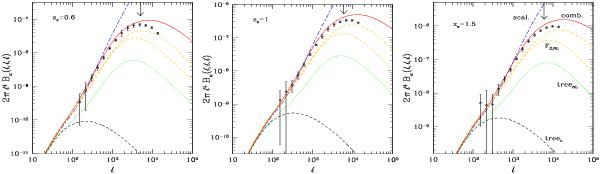
Convergence bispectrum for sources at redshifts zs = 0.6,1, and 1.5, for equilateral triangles. The points are the results from numerical simulations with 3-σ error bars. The low black dashed line “treeL” is the tree-order bispectrum (28), the green dotted line “treeNL” is the tree-order formula (30), where we use the nonlinear power from the “halo-fit” of Smith et al. (2003), the two yellow dashed lines “F2,NL” (31) include in addition a fitting formula for the kernel F2,NL from Scoccimarro & Couchman (2001) and use either PS(k) (lower curve) or Ptang(k) (upper curve) for the 3D power spectrum, the upper blue dot-dashed line “scal.” is the phenomenological scale transformation (32) from Pan et al. (2007), and the red solid line “comb.” is our combined model (13)–(16). The vertical arrows are at the same scale as in Fig. 1.
Current usage metrics show cumulative count of Article Views (full-text article views including HTML views, PDF and ePub downloads, according to the available data) and Abstracts Views on Vision4Press platform.
Data correspond to usage on the plateform after 2015. The current usage metrics is available 48-96 hours after online publication and is updated daily on week days.
Initial download of the metrics may take a while.