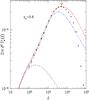
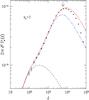
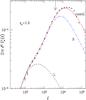
Fig. 1
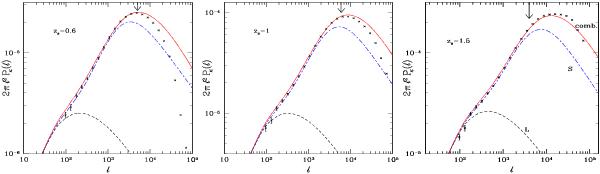
Convergence power spectrum for sources at redshifts zs = 0.6,1, and 1.5. The points are the results from numerical simulations with 3-σ error bars. The low black dashed line “L” is the linear power, the middle blue dot-dashed line “S” is the result from the “halo-fit” of Smith et al. (2003), and the upper red solid line “comb.” is the result from our model, which combines 1-loop perturbation theory with a halo model. The vertical arrow close to the peak shows the scale up to which the simulation result is valid within 5%.
Current usage metrics show cumulative count of Article Views (full-text article views including HTML views, PDF and ePub downloads, according to the available data) and Abstracts Views on Vision4Press platform.
Data correspond to usage on the plateform after 2015. The current usage metrics is available 48-96 hours after online publication and is updated daily on week days.
Initial download of the metrics may take a while.