Fig. 4
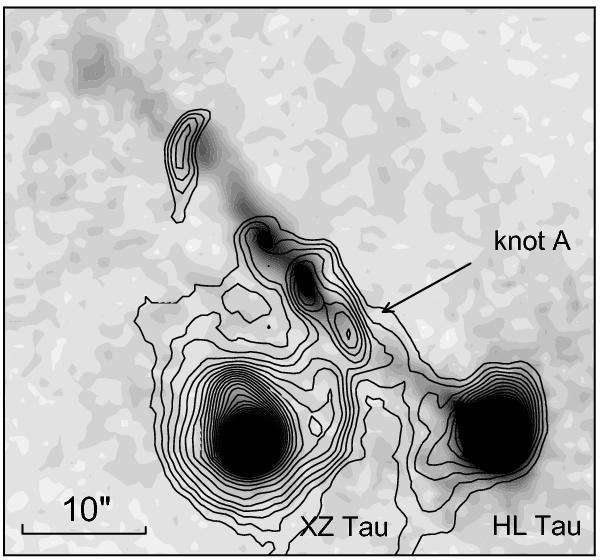
Superposition of the HL/XZ Tau FP images in the monochromatic [S ii] λ6716 Å line emission (greyscale) and low-velocity Hα emission (contours). The Hα observations were performed in Sept. 2001 (see Sect. 2), the [S ii] data were taken in Jan. 2003 (Movsessian et al. 2007). Knot A (shown by arrow) is visible only in Hα and appears as a continuation of the Hα emission arcuate structure west of XZ Tau.
Current usage metrics show cumulative count of Article Views (full-text article views including HTML views, PDF and ePub downloads, according to the available data) and Abstracts Views on Vision4Press platform.
Data correspond to usage on the plateform after 2015. The current usage metrics is available 48-96 hours after online publication and is updated daily on week days.
Initial download of the metrics may take a while.