Fig. 1
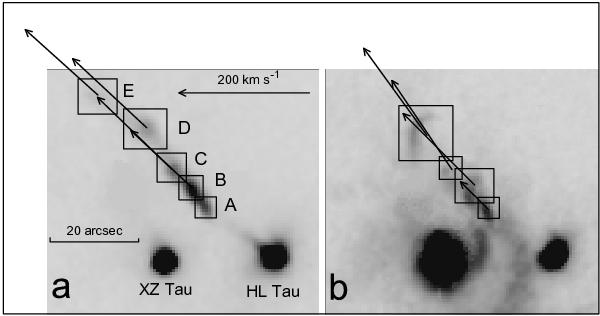
Proper motions of the structures in the A, B, C, D, and E knots of HL Tau jet, corresponding to high a) and low b) radial velocities, are shown by vectors plotted in the images in Hα emission corresponding to −150 km s -1 and −50 km s -1, respectively. The scale of the vectors is indicated by the arrow at the top of the left panel. Rectangles show the areas used for the difference square method.
Current usage metrics show cumulative count of Article Views (full-text article views including HTML views, PDF and ePub downloads, according to the available data) and Abstracts Views on Vision4Press platform.
Data correspond to usage on the plateform after 2015. The current usage metrics is available 48-96 hours after online publication and is updated daily on week days.
Initial download of the metrics may take a while.