Fig. 8
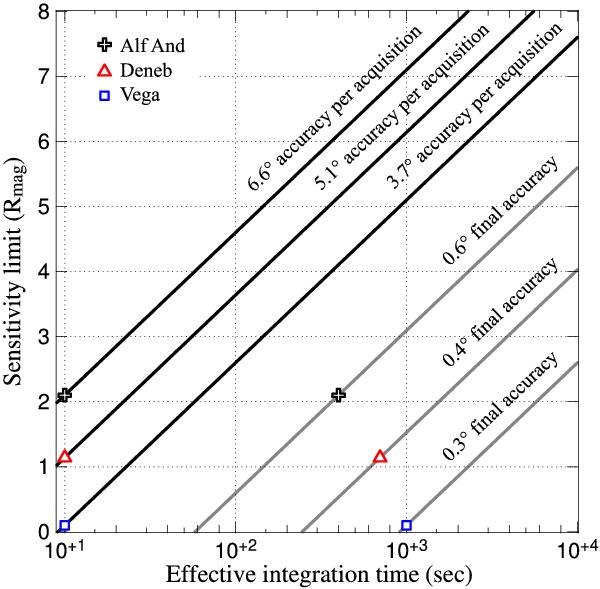
Sensitivity limits as a function of the integration time for given closure phase accuracies per acquisition. These curves have been extrapolated from the accuracies measured on Vega (square at Rmag = 0.1), Deneb (triangle at Rmag = 1.14) and Alf And (cross at Rmag = 2.1). Two curves are drawn per target: the black one is extrapolated from the mean accuracy per acquisition and the gray one from the final best statistical error. The accuracies are given for uncalibrated measurements.
Current usage metrics show cumulative count of Article Views (full-text article views including HTML views, PDF and ePub downloads, according to the available data) and Abstracts Views on Vision4Press platform.
Data correspond to usage on the plateform after 2015. The current usage metrics is available 48-96 hours after online publication and is updated daily on week days.
Initial download of the metrics may take a while.