Fig. 4
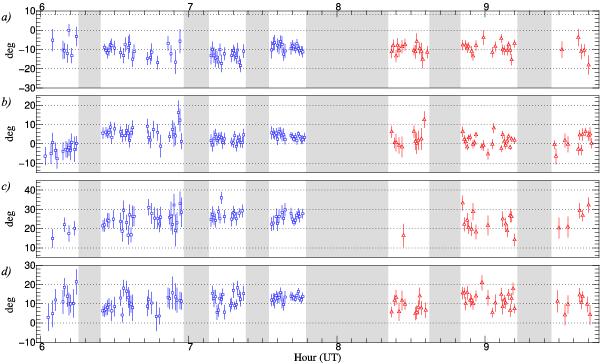
Estimates of the closure phase of Vega (blue squares) and Deneb (red triangles) with rescaled error bars, corresponding to the contributions of four sub-pupils numbered 1, 2, 6 and 13: a) 1-2-6; b) 1-2-13; c) 1-6-13; d) 2-6-13. Each estimate corresponds to 10 s of observation (average of 50 images of 200 ms integrations). The error bars represent the standard deviation of the mean over the 50 frames (i.e. the frame-to-frame standard deviation weighted by the modulus of the bispectrum divided by  ). The gray rectangles represent the periods when no data were taken.
Current usage metrics show cumulative count of Article Views (full-text article views including HTML views, PDF and ePub downloads, according to the available data) and Abstracts Views on Vision4Press platform.
Data correspond to usage on the plateform after 2015. The current usage metrics is available 48-96 hours after online publication and is updated daily on week days.
Initial download of the metrics may take a while.