Fig. 3
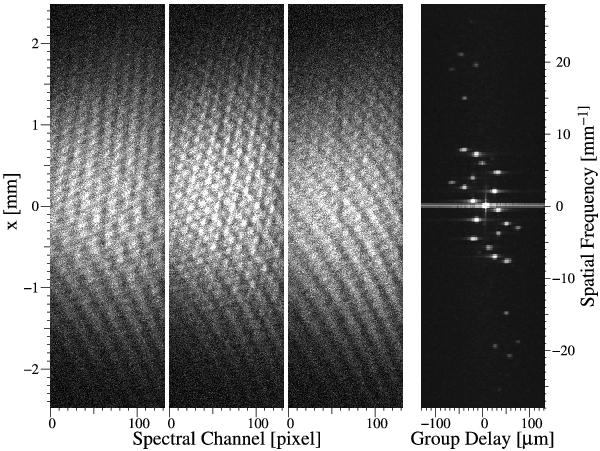
The three images to the left are samples of the acquired data on Vega, where fringes are particularly visible. The right panel is the 2D Spectral Power Density averaged over 40 data cubes of 50 images each, in a logarithmic scale. One can distinguish 13 peaks, meaning that at least 6 fibers contributed to the interferograms in this particular set of data.
Current usage metrics show cumulative count of Article Views (full-text article views including HTML views, PDF and ePub downloads, according to the available data) and Abstracts Views on Vision4Press platform.
Data correspond to usage on the plateform after 2015. The current usage metrics is available 48-96 hours after online publication and is updated daily on week days.
Initial download of the metrics may take a while.