Fig. 4
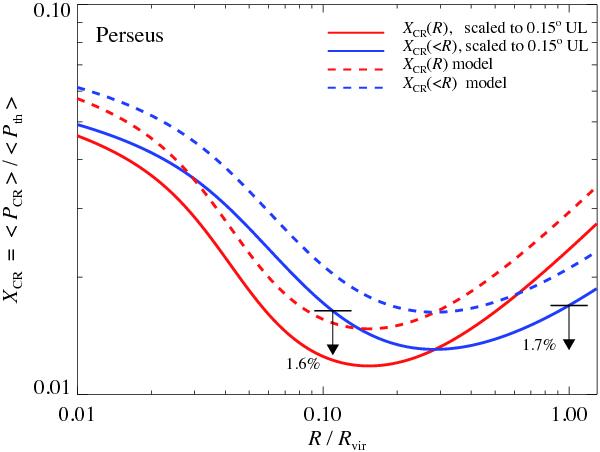
CR-to-thermal pressure ratio, XCR = ⟨PCR⟩/⟨Pth⟩ at the radial distance from the Perseus cluster center, R/Rvir (red lines), and integrated up to R/Rvir (blue lines), using the simulation-based analytical model of CRs (Pinzke & Pfrommer 2010). The simulation model (dashed) is contrasted to a model that has been scaled by the MAGIC constraints obtained in this work (solid).
Current usage metrics show cumulative count of Article Views (full-text article views including HTML views, PDF and ePub downloads, according to the available data) and Abstracts Views on Vision4Press platform.
Data correspond to usage on the plateform after 2015. The current usage metrics is available 48-96 hours after online publication and is updated daily on week days.
Initial download of the metrics may take a while.