Free Access
Fig. 4
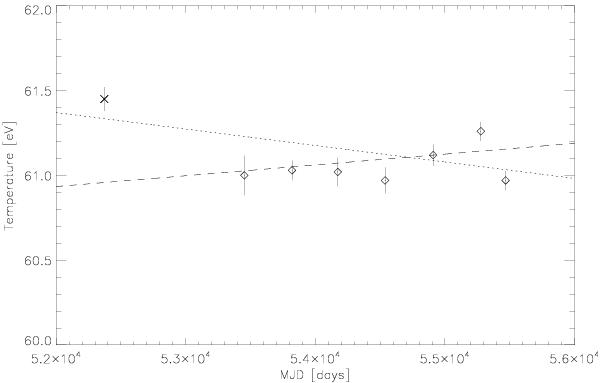
Long-term evolution of the temperature for “soft” observations. The dotted line represents the linear fit to the data. The dashed line represents a linear fit to the data without considering the observation of April 2002, which is marked by the X symbol. Error bars correspond to 3σ confidence intervals.
Current usage metrics show cumulative count of Article Views (full-text article views including HTML views, PDF and ePub downloads, according to the available data) and Abstracts Views on Vision4Press platform.
Data correspond to usage on the plateform after 2015. The current usage metrics is available 48-96 hours after online publication and is updated daily on week days.
Initial download of the metrics may take a while.