Fig. 3
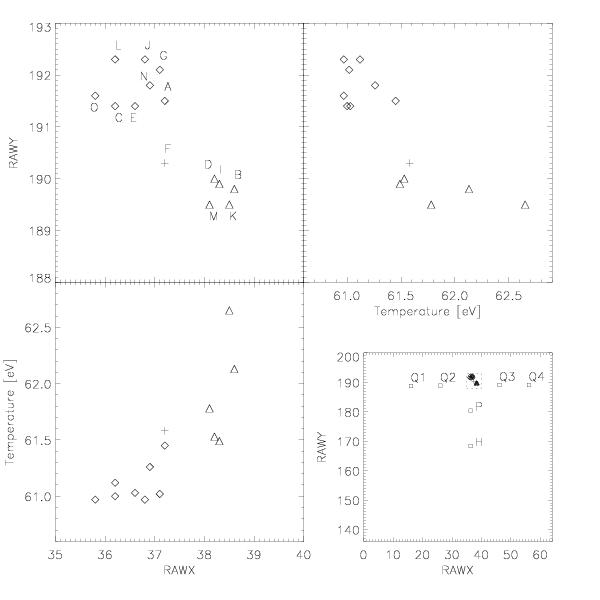
Lower right panel: position of the source in detector coordinates (RAWX, RAWY). The region in the dashed square is enlarged in the upper left panel. The symbols indicate the different observations: “soft” region (diamonds), “hard” region (triangles), observation F (plus), and off-axis observations (squares). The other two panels indicate the temperature as a function of the source position.
Current usage metrics show cumulative count of Article Views (full-text article views including HTML views, PDF and ePub downloads, according to the available data) and Abstracts Views on Vision4Press platform.
Data correspond to usage on the plateform after 2015. The current usage metrics is available 48-96 hours after online publication and is updated daily on week days.
Initial download of the metrics may take a while.