Fig. 2
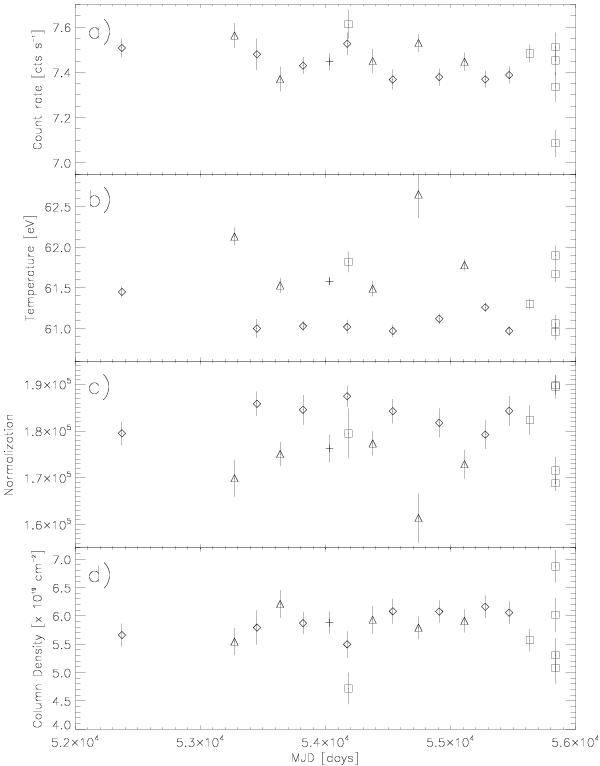
Long-term evolution of the spectral parameters obtained with a single BB fit in the 0.15−1.2 keV range. Panels a), b), and c), show the count rate, temperature, and BB normalization of a simultaneous fit with the column density fixed to a common value. Panel d) indicates the column density obtained when, instead, the BB parameters are fixed to a common value for all the observations (see text). Diamonds, triangles, and squares represent “soft”, “hard”, and off-axis observations, respectively. The plus symbol is the October 2006 observation, which is at an intermediate detector position (see Fig. 3). Error bars correspond to 3σ confidence intervals.
Current usage metrics show cumulative count of Article Views (full-text article views including HTML views, PDF and ePub downloads, according to the available data) and Abstracts Views on Vision4Press platform.
Data correspond to usage on the plateform after 2015. The current usage metrics is available 48-96 hours after online publication and is updated daily on week days.
Initial download of the metrics may take a while.