Free Access
Fig. 2
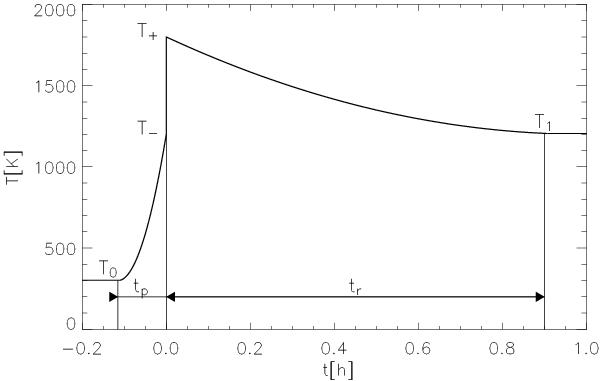
Schematic temperature curve as required by chondrule characteristics with preheating wave T0 = 300 K up to T− = 1200 K in tV = 400 s (R > 104 K h-1). The shock front heats the gas to T+ = 1800 K and during the subsequent relaxation time the temperature drops to T1 = 1200 K.
Current usage metrics show cumulative count of Article Views (full-text article views including HTML views, PDF and ePub downloads, according to the available data) and Abstracts Views on Vision4Press platform.
Data correspond to usage on the plateform after 2015. The current usage metrics is available 48-96 hours after online publication and is updated daily on week days.
Initial download of the metrics may take a while.