Fig. 3
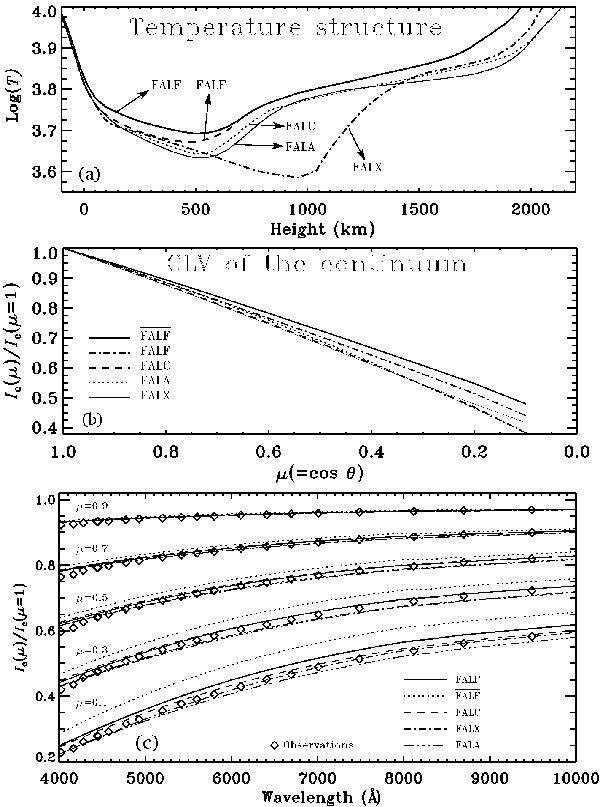
Panel a) shows the temperature structure of several standard model atmospheres.  represents a model with an enhanced temperature structure of the original FALF model. In panel b) we show the center to limb variation of the “limb darkening function”, Ic(μ)/Ic(μ = 1), where Ic(μ) is the continuum intensity near the Cr i triplet. Panel c) shows the CLV of the continuum intensity for all wavelengths covering the violet to the IR regions of the spectrum. The observed data are taken from Neckel & Labs (1994).
Current usage metrics show cumulative count of Article Views (full-text article views including HTML views, PDF and ePub downloads, according to the available data) and Abstracts Views on Vision4Press platform.
Data correspond to usage on the plateform after 2015. The current usage metrics is available 48-96 hours after online publication and is updated daily on week days.
Initial download of the metrics may take a while.