Fig. 11
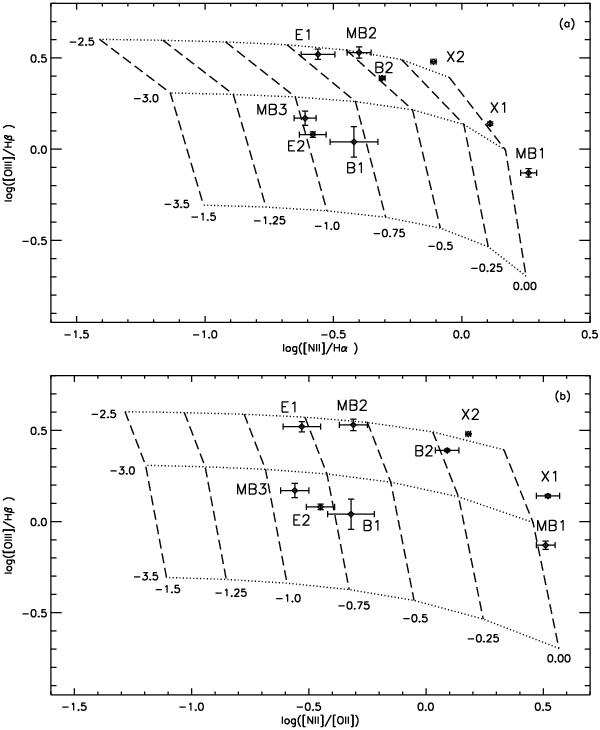
Diagnostic diagrams containing the results of our photoionization models and observed data. a) [OIII]λλ5007/ Hβ vs. [NII]λλ6584/Hα and b) [OIII]λλ5007/Hβ vs. [NII]λ6584/ [OII]λλ3726, 3729. In all the diagrams, the dotted lines connect points with the same ionization parameter. The dashed lines connect curves of equal log (N/O). The respective values are indicated at the beginning of curves. For all the models we assumed 12 + log (O/H)) = 8.47. Points are values of integrated spectra placed according to their intensities ratios (named as in Table 3 and Fig. 9).
Current usage metrics show cumulative count of Article Views (full-text article views including HTML views, PDF and ePub downloads, according to the available data) and Abstracts Views on Vision4Press platform.
Data correspond to usage on the plateform after 2015. The current usage metrics is available 48-96 hours after online publication and is updated daily on week days.
Initial download of the metrics may take a while.