Fig. 5
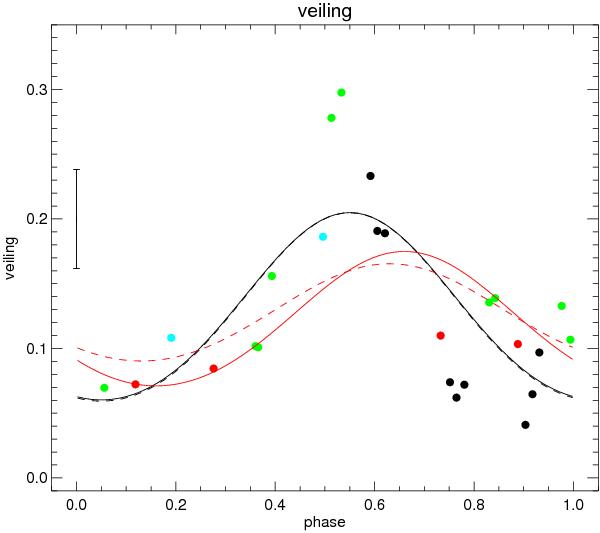
Best-fit hot spot model for the HARPS veiling variations (black lines). The red lines represent the veiling generated by the optimal hot spot fits to the He i radial velocity variations (Fig. 6). Models with i = 60° and i = 45° are shown as solid and dashed lines, respectively . The mean error bar in the observed veiling is shown on the left and the color code of the points is the same as in Fig. 1.
Current usage metrics show cumulative count of Article Views (full-text article views including HTML views, PDF and ePub downloads, according to the available data) and Abstracts Views on Vision4Press platform.
Data correspond to usage on the plateform after 2015. The current usage metrics is available 48-96 hours after online publication and is updated daily on week days.
Initial download of the metrics may take a while.