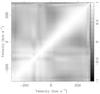
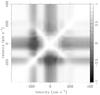
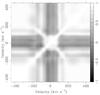
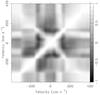
Fig. 19
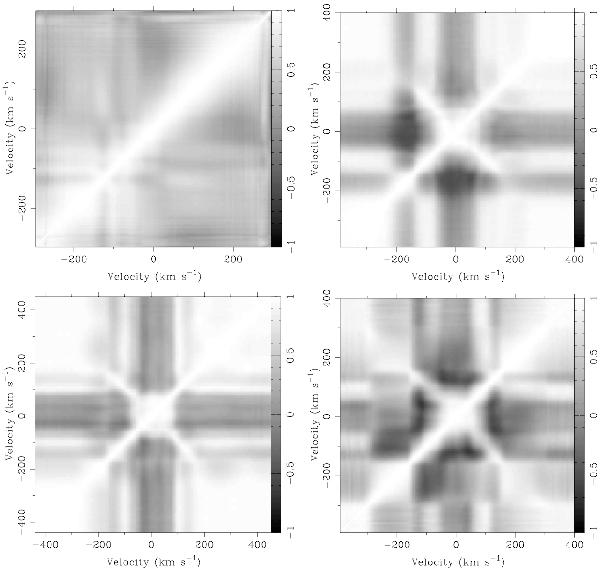
Hα autocorrelation matrices. The gray scale represents the linear correlation coefficient (r). White corresponds to a positive correlation (r = 1) and black to an anti-correlation (r = −1). Top left: observed data. Top right: dipole-only model with γ = 5/3. Bottom left: dipole-only model with γ = 1.2. Bottom right: dipole+octupole model with γ = 1.2.
Current usage metrics show cumulative count of Article Views (full-text article views including HTML views, PDF and ePub downloads, according to the available data) and Abstracts Views on Vision4Press platform.
Data correspond to usage on the plateform after 2015. The current usage metrics is available 48-96 hours after online publication and is updated daily on week days.
Initial download of the metrics may take a while.