Fig. 17
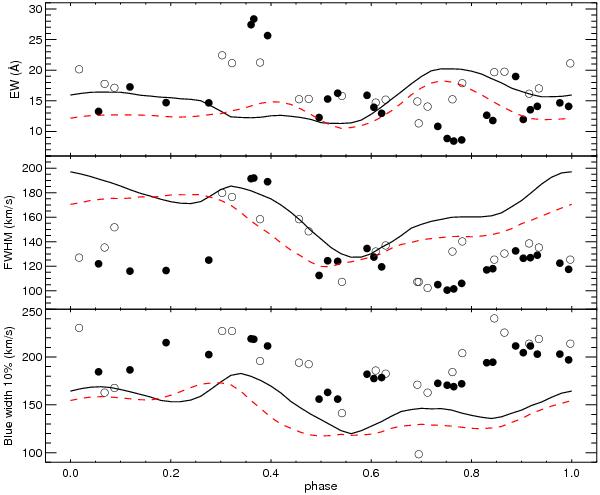
Hα line EW (top), full width at half maxima (middle), and blue side width at 10% of the peak intensity (bottom) as a function of rotational phase. HARPS and ESPaDONs data are shown as filled and open dots, respectively. The values measured in the profiles of the dipole-only (solid line) and dipole+octupole (dashed line) models are overplotted.
Current usage metrics show cumulative count of Article Views (full-text article views including HTML views, PDF and ePub downloads, according to the available data) and Abstracts Views on Vision4Press platform.
Data correspond to usage on the plateform after 2015. The current usage metrics is available 48-96 hours after online publication and is updated daily on week days.
Initial download of the metrics may take a while.