Fig. 10
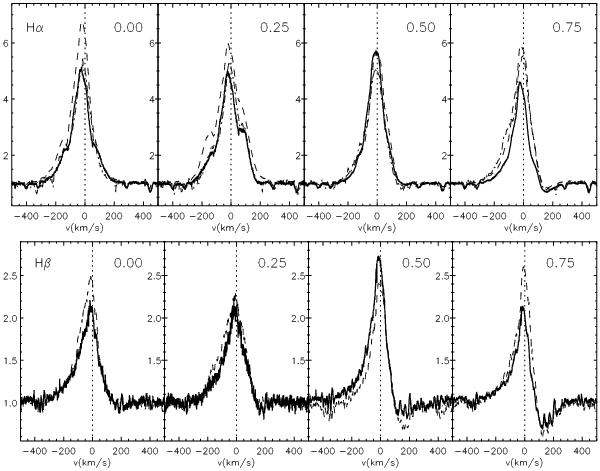
Hα (top) and Hβ (bottom) profiles obtained with the HARPS (solid), ESPaDOnS (dashed), and SMARTS (dash-dotted, Hα only) spectrographs. The spectra correspond to a mean profile around the phases given in the panels. The profiles are normalized to the continuum level and the vertical dotted lines indicate the stellar rest velocity.
Current usage metrics show cumulative count of Article Views (full-text article views including HTML views, PDF and ePub downloads, according to the available data) and Abstracts Views on Vision4Press platform.
Data correspond to usage on the plateform after 2015. The current usage metrics is available 48-96 hours after online publication and is updated daily on week days.
Initial download of the metrics may take a while.