Fig. 9
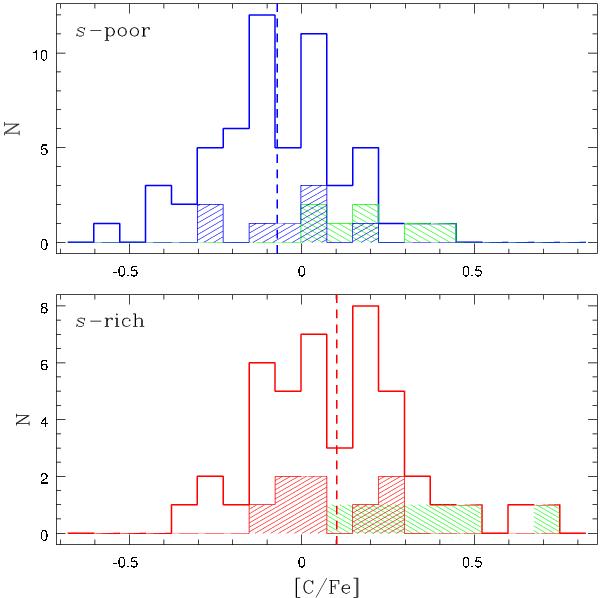
Carbon abundance relative to Fe distributions for the s-poor (upper panel) and s-rich (lower panel) stars. In each panel the dashed line represents the mean [C/Fe] abundance. The location of the stars selected for constructing the average s-rich and s-poor spectrum (see Fig. 7) has been indicated with dashed red and blue histograms, respectively. The dashed green histogram represents the location of stars with Teff > 6000 K, showing a rise in C with temperature.
Current usage metrics show cumulative count of Article Views (full-text article views including HTML views, PDF and ePub downloads, according to the available data) and Abstracts Views on Vision4Press platform.
Data correspond to usage on the plateform after 2015. The current usage metrics is available 48-96 hours after online publication and is updated daily on week days.
Initial download of the metrics may take a while.