Fig. 5
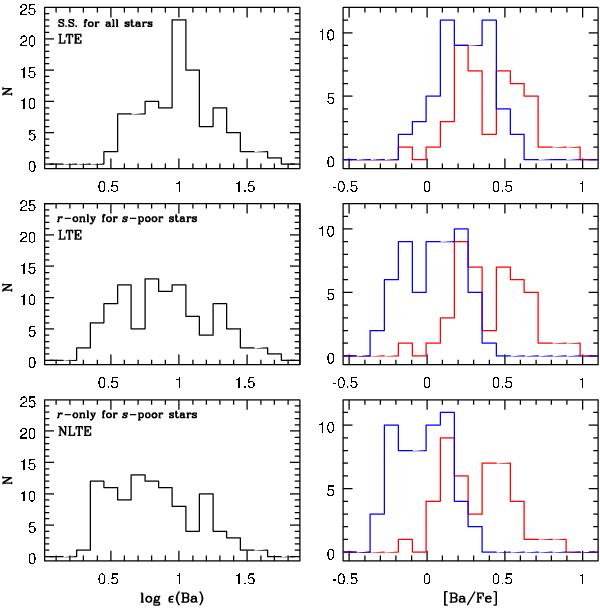
Observed distribution of Ba in log(ϵ) abundances (left panels) and in abundance ratios relative to iron (right panels). The histogram distributions of [Ba/Fe] for s-rich and s-poor stars selected as in Fig. 4, have been represented in red and blue, respectively. The upper panels represent Ba abundances with Solar System (S.S.) isotopic ratios adopted for both s-rich and s-poor stars. In the middle panels, an r-only isotopic ratio has been applied for the s-poor stars. The lower panels represent the same abundances represented in the middle panels corrected for NLTE effects.
Current usage metrics show cumulative count of Article Views (full-text article views including HTML views, PDF and ePub downloads, according to the available data) and Abstracts Views on Vision4Press platform.
Data correspond to usage on the plateform after 2015. The current usage metrics is available 48-96 hours after online publication and is updated daily on week days.
Initial download of the metrics may take a while.