Fig. 16
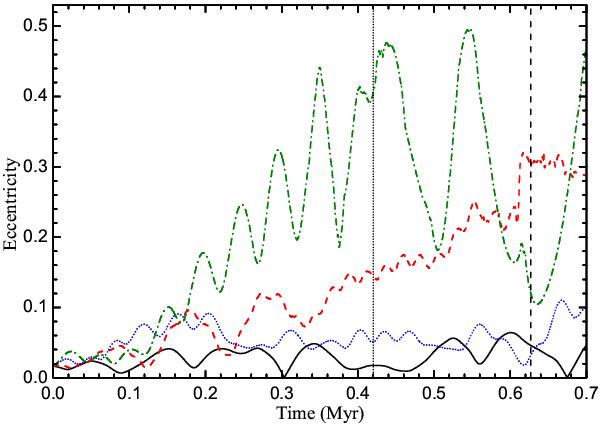
The eccentricity evolution for four orbits. The solid curves represent the orbits with initial inclination i = 10° (solid black), 22° (dash red), 35° (dot blue), and 42° (dash-dot green), respectively. The vertical dash and dot lines mark the moments when the orbits escape from the 1:1 MMR for i = 22° and i = 42°, respectively.
Current usage metrics show cumulative count of Article Views (full-text article views including HTML views, PDF and ePub downloads, according to the available data) and Abstracts Views on Vision4Press platform.
Data correspond to usage on the plateform after 2015. The current usage metrics is available 48-96 hours after online publication and is updated daily on week days.
Initial download of the metrics may take a while.