Free Access
Fig. 12
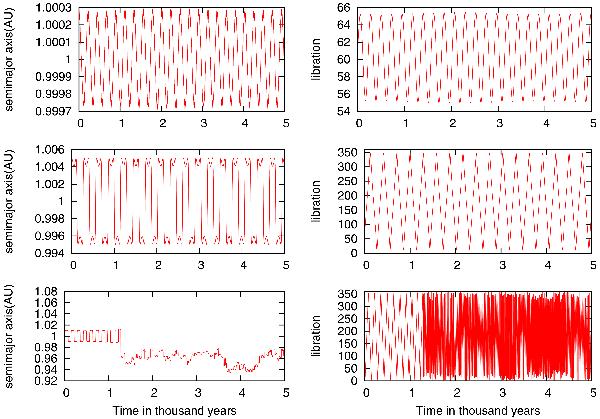
The temporal evolution of three orbits: a tadpole (upper graphs), a horseshoe, (middle graphs) and an escaping orbit (lower graphs). In six panels we show the evolutions of the semimajor axes (left graphs) and the libration angles (right graphs) over 5000 years.
Current usage metrics show cumulative count of Article Views (full-text article views including HTML views, PDF and ePub downloads, according to the available data) and Abstracts Views on Vision4Press platform.
Data correspond to usage on the plateform after 2015. The current usage metrics is available 48-96 hours after online publication and is updated daily on week days.
Initial download of the metrics may take a while.