Fig. 5
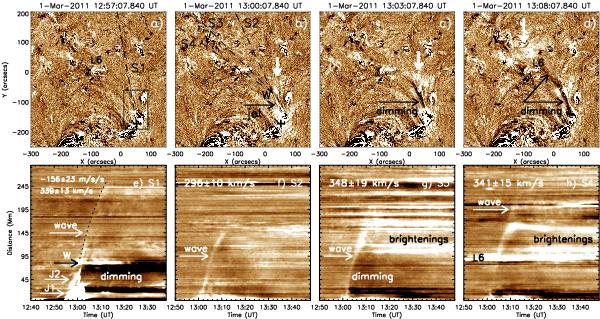
Sequential base difference images in AIA 193 Å (upper panels) displaying the evolution of the wave, and base difference time-slice images (bottom panels) along the sectors S1 − S4 (dashed lines in panels a) − b)). S1 starts from the eruption center, indicated by the plus, and S2 − S4 emanates from W. The box in panel a) shows the FOV of Fig. 4. Wave signatures are indicated by arrows, with the linear fitted velocities and quadratic fitted acceleration attached above. The temporal evolution in the AIA 193 Å as seen in the upper panels is shown in the movie available in the online edition.
Current usage metrics show cumulative count of Article Views (full-text article views including HTML views, PDF and ePub downloads, according to the available data) and Abstracts Views on Vision4Press platform.
Data correspond to usage on the plateform after 2015. The current usage metrics is available 48-96 hours after online publication and is updated daily on week days.
Initial download of the metrics may take a while.