Free Access
Fig. 9
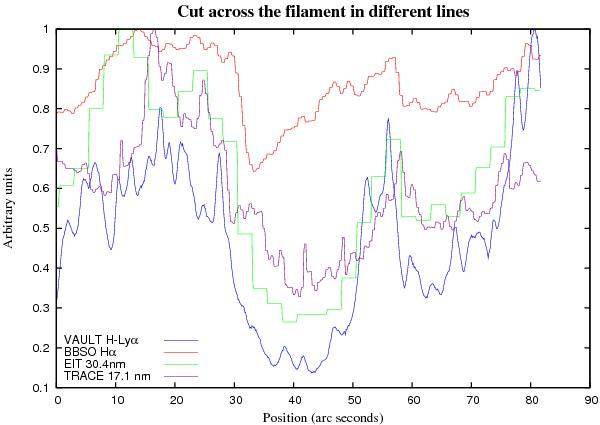
Cut at position 3 of the filament in different lines: VAULT H-Lyα is plotted in BLUE, BBSO Hα in red, EIT 30.4 nm in green, and TRACE 17.1 nm in PURPLE. The arbitrary units are obtained by dividing the cut intensity by its maximum value.
Current usage metrics show cumulative count of Article Views (full-text article views including HTML views, PDF and ePub downloads, according to the available data) and Abstracts Views on Vision4Press platform.
Data correspond to usage on the plateform after 2015. The current usage metrics is available 48-96 hours after online publication and is updated daily on week days.
Initial download of the metrics may take a while.