Free Access
Fig. A.2
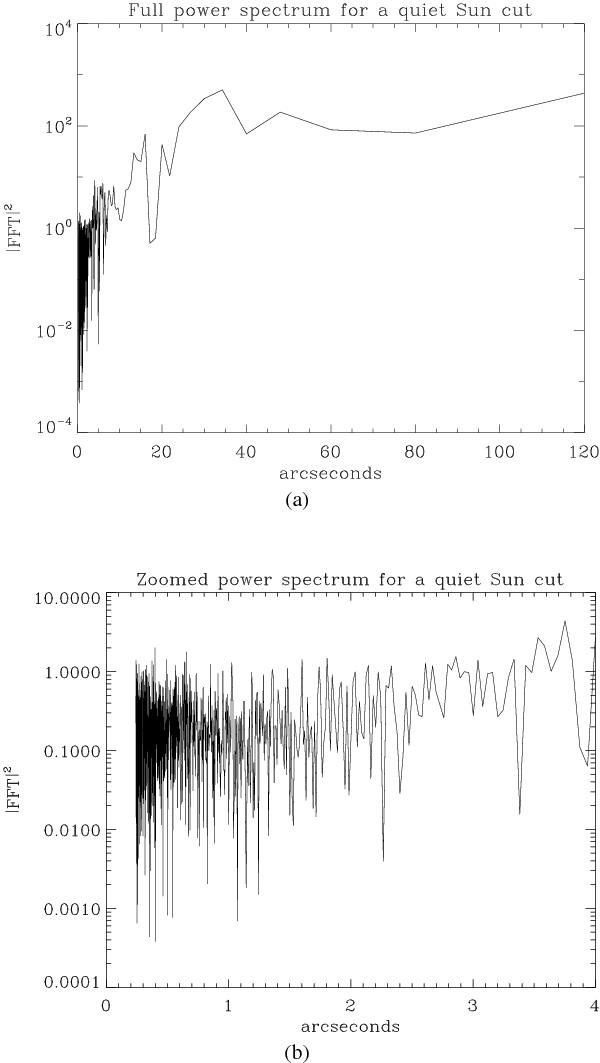
Square of the modulus of the FFT as a function of spatial frequency (converted in spatial scale) for a cut in the quiet Sun at X = 3000 of Fig. 4. a) Full power spectrum obtained for the cut. b) Zoom on the high frequencies.
This figure is made of several images, please see below:
Current usage metrics show cumulative count of Article Views (full-text article views including HTML views, PDF and ePub downloads, according to the available data) and Abstracts Views on Vision4Press platform.
Data correspond to usage on the plateform after 2015. The current usage metrics is available 48-96 hours after online publication and is updated daily on week days.
Initial download of the metrics may take a while.