Fig. 5
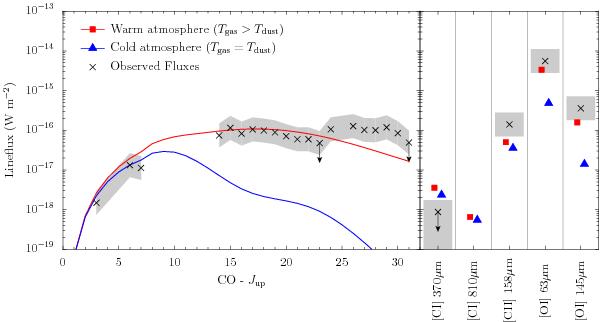
Integrated line fluxes obtained from the representative model. The left part of the figure shows the CO ladder and the right part atomic fine-structure lines. Observations are indicated by black crosses. The red line and squares show model fluxes for a model with calculated gas temperature, the blue line and triangles with Tgas set to Tdust. The gray shaded region indicates a factor of two to the observed fluxes.
Current usage metrics show cumulative count of Article Views (full-text article views including HTML views, PDF and ePub downloads, according to the available data) and Abstracts Views on Vision4Press platform.
Data correspond to usage on the plateform after 2015. The current usage metrics is available 48-96 hours after online publication and is updated daily on week days.
Initial download of the metrics may take a while.