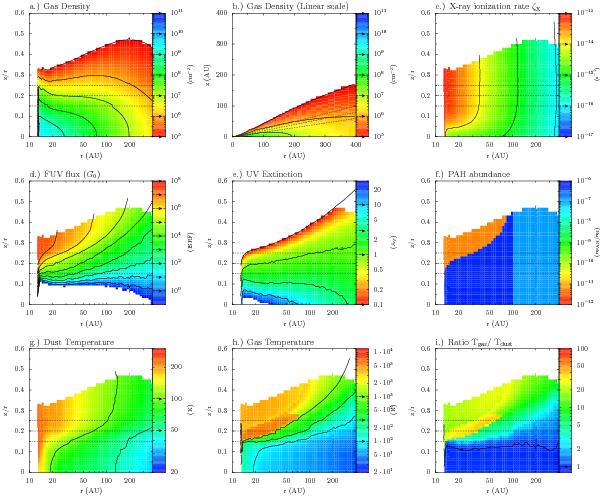
Fig. 3

Physical conditions in the representative model. The contour lines are shown for values indicated in the label by small arrows. The thin dashed line indicates z/r = 0.15,0.2, and 0.25. The panels show: a) gas density; b) gas density in linear scale; c) total ionization rate; d) local FUV flux; e) FUV extinction. f) PAH abundance in units of the ISM abundance; g) dust temperature; h) gas temperature; i) ratio of the gas to dust temperature.
Current usage metrics show cumulative count of Article Views (full-text article views including HTML views, PDF and ePub downloads, according to the available data) and Abstracts Views on Vision4Press platform.
Data correspond to usage on the plateform after 2015. The current usage metrics is available 48-96 hours after online publication and is updated daily on week days.
Initial download of the metrics may take a while.


