Fig. A.6
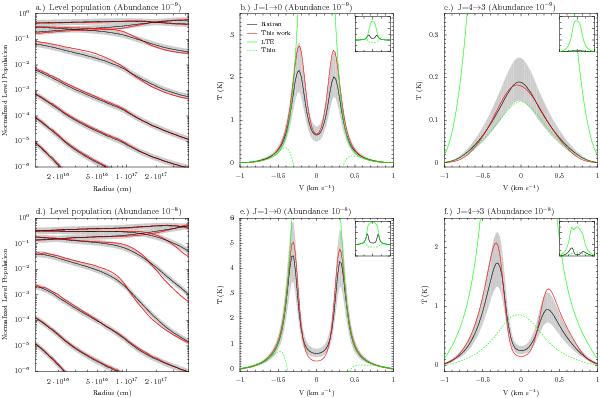
Result of the benchmark of the excitation calculation. The upper panel shows the results for a HCO+ abundance of 10-9 relative to H2, the lower panel for an abundance of 10-8 relative to H2. The plots on the left display the normalized level population of the first eight levels, the plots on the right show beam-averaged intensities. The black lines give results obtained using the RATRAN code, and the red dots/lines show results derived by this work. The gray shaded area indicates a 30% range to the RATRAN solution.
Current usage metrics show cumulative count of Article Views (full-text article views including HTML views, PDF and ePub downloads, according to the available data) and Abstracts Views on Vision4Press platform.
Data correspond to usage on the plateform after 2015. The current usage metrics is available 48-96 hours after online publication and is updated daily on week days.
Initial download of the metrics may take a while.