Fig. 4
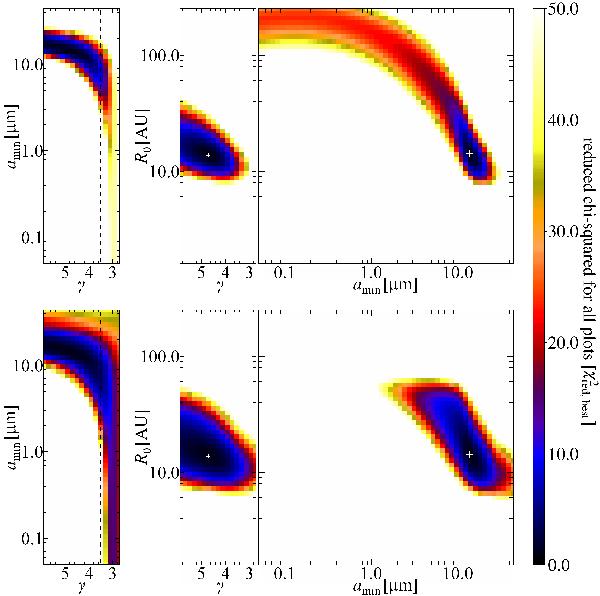
χ2 maps for HIP 114948. The maps are created as two dimensional cuts through the χ2 distribution in the parameter space searched with GRaTer without (top) and with (bottom) the spatial information included. The parameters not plotted are fixed to their best-fit value, respectively (Table 6). The correlations between the three most relevant parameters (γ, amin, and R0) are shown. The white cross denotes the position of the best-fit (lowest χ2). The dashed vertical line denotes the value of γ = 3.5 expected from a standard equilibrium collisional cascade.
Current usage metrics show cumulative count of Article Views (full-text article views including HTML views, PDF and ePub downloads, according to the available data) and Abstracts Views on Vision4Press platform.
Data correspond to usage on the plateform after 2015. The current usage metrics is available 48-96 hours after online publication and is updated daily on week days.
Initial download of the metrics may take a while.