Fig. 3
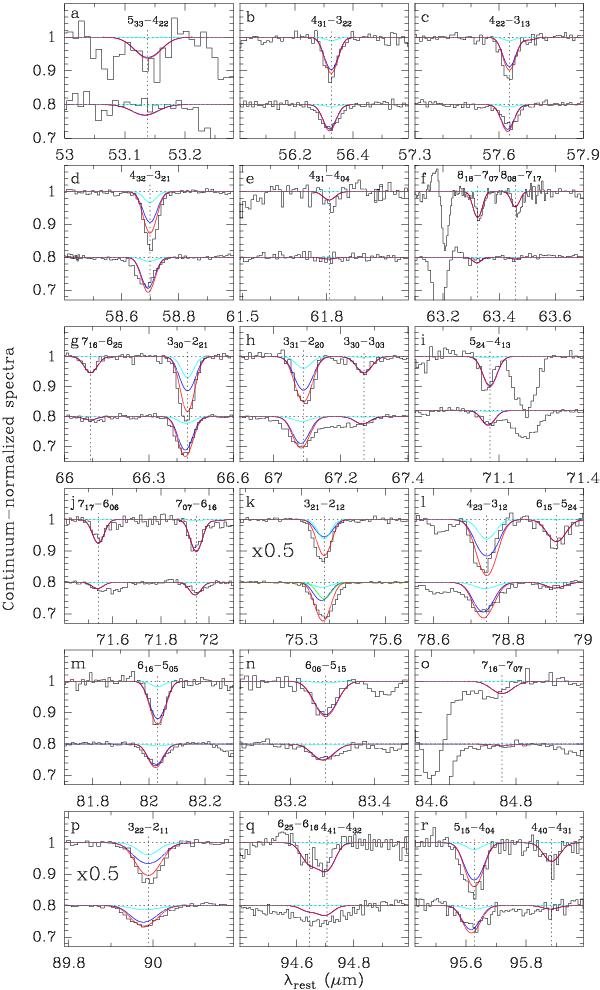
H2O lines in the blue and green bands (λ < 100 μm) detected in NGC 4418 (upper spectra in each panel) and Arp 220 (lower spectra). The spectra, histograms with black solid lines, have been scaled by a factor of 0.5 in panels k) and p). Vertical dotted lines indicate the rest wavelengths of the lines relative to z = 0.00705 and 0.0181 for NGC 4418 and Arp 220, respectively. Model results are also shown. For NGC 4418, the blue and light-blue curves show the models for the Ccore and Cwarm components, respectively; for Arp 220, the blue and light-blue lines show the estimated contributions from Cwest and Ceast , and the green curve (in panel k) shows the contribution by Cextended . Red is total. Model parameters are given in Tables 1 and 2.
Current usage metrics show cumulative count of Article Views (full-text article views including HTML views, PDF and ePub downloads, according to the available data) and Abstracts Views on Vision4Press platform.
Data correspond to usage on the plateform after 2015. The current usage metrics is available 48-96 hours after online publication and is updated daily on week days.
Initial download of the metrics may take a while.