Fig. 1
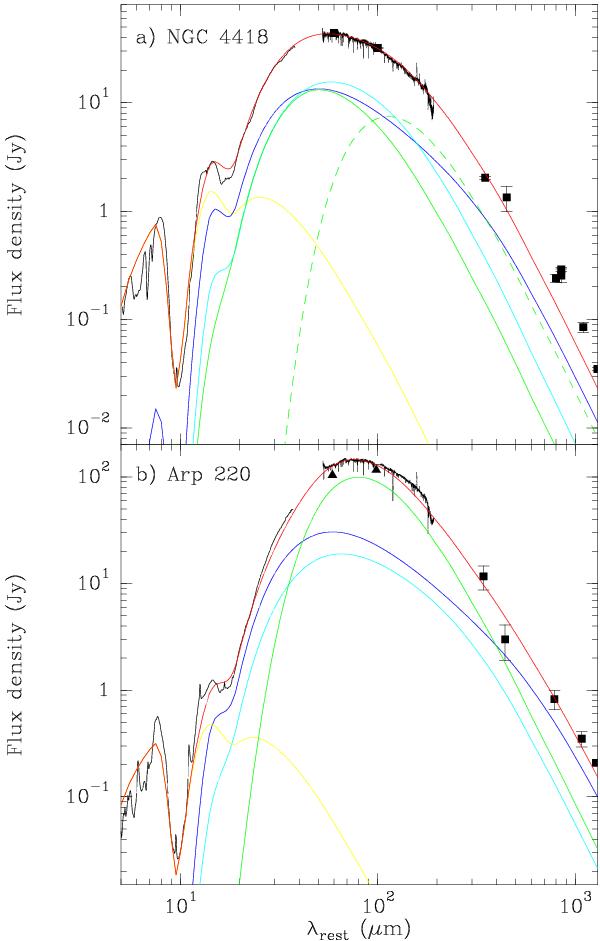
Spectral energy distribution of NGC 4418 and Arp 220 from mid-IR to millimeter wavelengths. Both the Herschel/PACS and the Spitzer/IRS spectra are shown. Data points at (sub)millimeter wavelengths for NGC 4418 are from (Yang & Phillips 2007, 350 μm), (Roche & Chandler 1993, 450, 800, and 1100 μm), (Dunne et al. 2000; Lisenfeld et al. 2000, 850 μm), and (Albrecht et al. 2007, 1300 μm). For Arp 220, they are taken from (Eales et al. 1989, 450 μm); (Rigopoulou et al. 1996, 350, 800, and 1100 μm); and (Sakamoto et al. 1999, 2008, 1300 μm). Models discussed in Sect. 3 are included. For NGC 4418, the yellow, blue, light-blue, and solid-green curves show the models for the hot, core, warm, and extended components, respectively, with parameters given in Table 1. An additional cold component, shown with the dashed-green curve, is included to better fit the SED at long wavelengths. For Arp 220, the yellow, blue, light-blue, and solid-green curves show the models for the hot, western nucleus, eastern nucleus, and extended components, respectively (Table 1).
Current usage metrics show cumulative count of Article Views (full-text article views including HTML views, PDF and ePub downloads, according to the available data) and Abstracts Views on Vision4Press platform.
Data correspond to usage on the plateform after 2015. The current usage metrics is available 48-96 hours after online publication and is updated daily on week days.
Initial download of the metrics may take a while.