Fig. 7
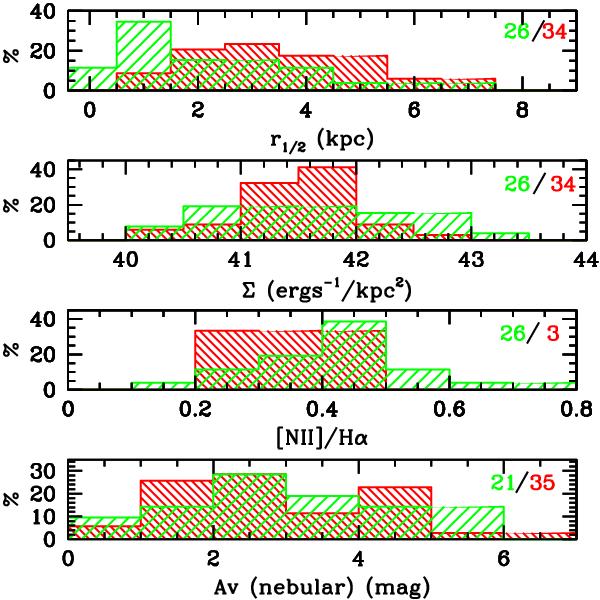
Comparison of different properties between the local U/LIRGs and the infrared-selected SINS objects from Förster-Schreiber et al. (2009). The histograms are normalized to the total number of values in each sample, which are indicated in the upper- right corner of each panel. Note that the metallicity distribution for the high-z sample is defined by only three values.
Current usage metrics show cumulative count of Article Views (full-text article views including HTML views, PDF and ePub downloads, according to the available data) and Abstracts Views on Vision4Press platform.
Data correspond to usage on the plateform after 2015. The current usage metrics is available 48-96 hours after online publication and is updated daily on week days.
Initial download of the metrics may take a while.