Fig. 5
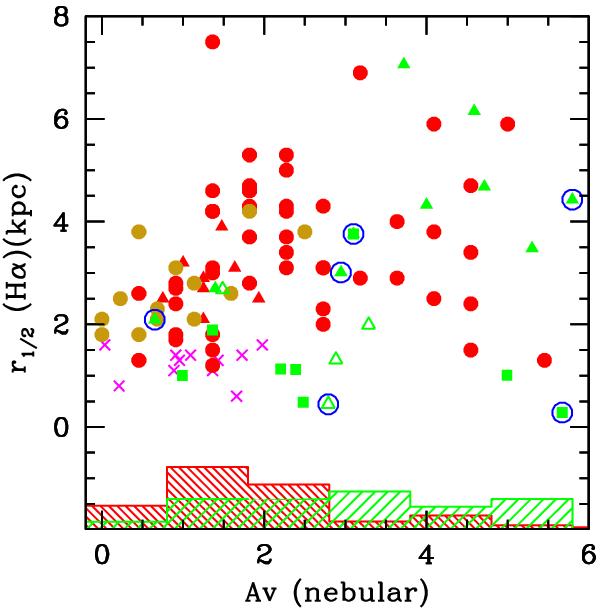
Av (nebular) as a function of Hα radius. Symbol code is the same as in previous figures. The histograms for the local and high-z samples are normalized to the total number of objects in each sample. For the high-z samples, Av were obtained from the literature SED fittings to global magnitudes, transformed to Av(nebular) following Calzetti et al. (2000) (i.e. Av(nebular) = Av(SED)/0.44). For the local sample, Av values were derived from the Balmer decrement within apertures of about 1–3 kpc (see GM09, RZ11).
Current usage metrics show cumulative count of Article Views (full-text article views including HTML views, PDF and ePub downloads, according to the available data) and Abstracts Views on Vision4Press platform.
Data correspond to usage on the plateform after 2015. The current usage metrics is available 48-96 hours after online publication and is updated daily on week days.
Initial download of the metrics may take a while.