Fig. 4
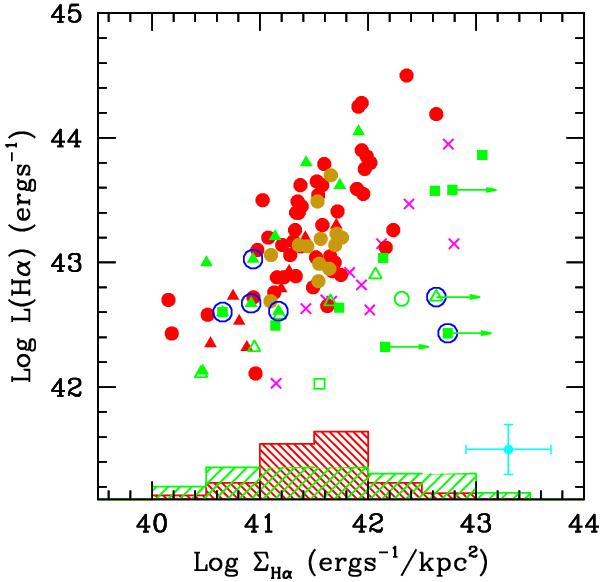
Hα luminosity density as a function of the Hα luminosity for local U/LIRGs and distant massive SFG with a similar luminosity range and observed under similar linear resolution conditions. Symbols are the same as in Fig. 3. The histograms for the local (green) and high-z (red) samples are normalized to the total number of objects in each sample. The blue cross in the lower-right corner indicates the typical errors.
Current usage metrics show cumulative count of Article Views (full-text article views including HTML views, PDF and ePub downloads, according to the available data) and Abstracts Views on Vision4Press platform.
Data correspond to usage on the plateform after 2015. The current usage metrics is available 48-96 hours after online publication and is updated daily on week days.
Initial download of the metrics may take a while.