Fig. 1
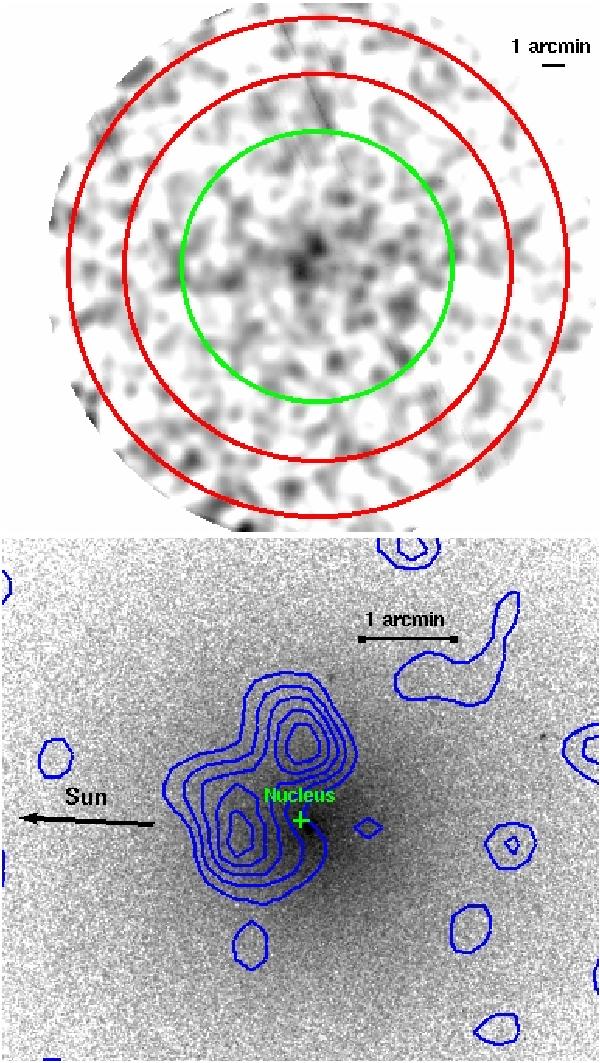
Upper panel: a smoothed 0.3 to 1 keV exposure corrected image of the stacked XRT event list following the transformations described in Sect. 2.1. The circle (green) and annulus (red) refer to regions used for spectral analysis, see Sect. 3.1. Lower panel: zoomed-in UV image of the comet, from the first UVW1 exposure of observation 31332 (see Table 1), taken with a pointing right ascension and declination of (231.44° and –17.89°), with X-ray contours from the upper image overlaid. Contours start at 1.0 × 10⁻³ ct s-1 arcmin-2 (~6.5 sigma above the background), and increase in increments of 0.4 × 10⁻³ ct s-1 arcmin-2. A one arcmin bar is shown on each panel.
Current usage metrics show cumulative count of Article Views (full-text article views including HTML views, PDF and ePub downloads, according to the available data) and Abstracts Views on Vision4Press platform.
Data correspond to usage on the plateform after 2015. The current usage metrics is available 48-96 hours after online publication and is updated daily on week days.
Initial download of the metrics may take a while.