Fig. 3
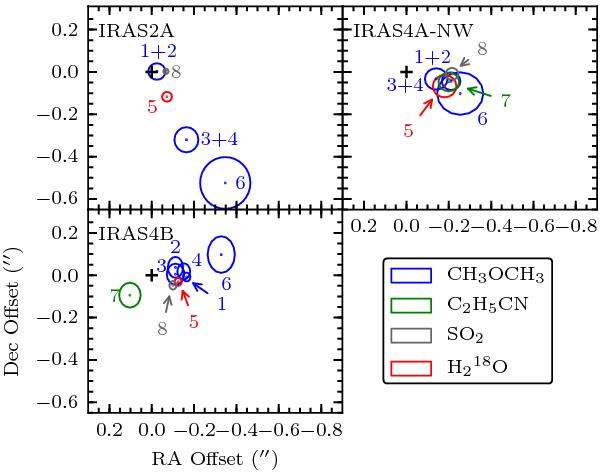
Positions of the lines from circular Gaussian fits in the (uv)-plane to the integrated line emission. The positions are plotted relative to the continuum peak position (cross) and the error in position for the continuum peak position is roughly the extent of the cross while the extent of the ellipses shows the error in position for the lines. Ellipses with the same colors represent the same molecule, while the numbers refer to a certain molecule and transition which has the same number in Fig. 1, Tables 3, A.1 and A.2. Many of the detected lines are systematically offset from the continuum peak.
Current usage metrics show cumulative count of Article Views (full-text article views including HTML views, PDF and ePub downloads, according to the available data) and Abstracts Views on Vision4Press platform.
Data correspond to usage on the plateform after 2015. The current usage metrics is available 48-96 hours after online publication and is updated daily on week days.
Initial download of the metrics may take a while.