Fig. 1
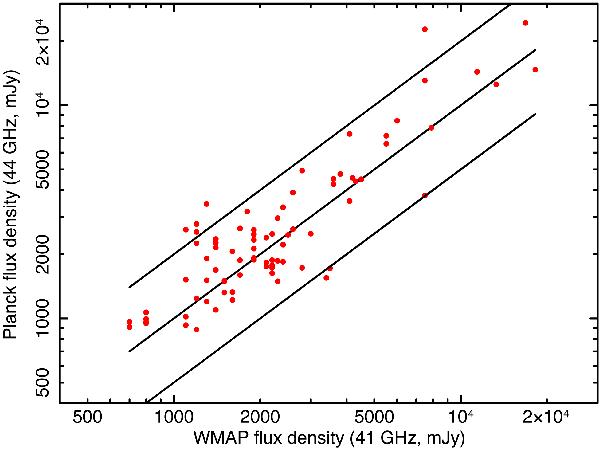
The Planck 44GHz flux density of the sources in our sample is plotted against the 41GHz flux density from the WMAP five-year catalog (81 sources). The three solid lines represent equal flux densities (i.e., no variation) and a factor of two variability above or below the equal flux level. Almost all the points lie between the factor of two variability lines.
Current usage metrics show cumulative count of Article Views (full-text article views including HTML views, PDF and ePub downloads, according to the available data) and Abstracts Views on Vision4Press platform.
Data correspond to usage on the plateform after 2015. The current usage metrics is available 48-96 hours after online publication and is updated daily on week days.
Initial download of the metrics may take a while.