Fig. 5
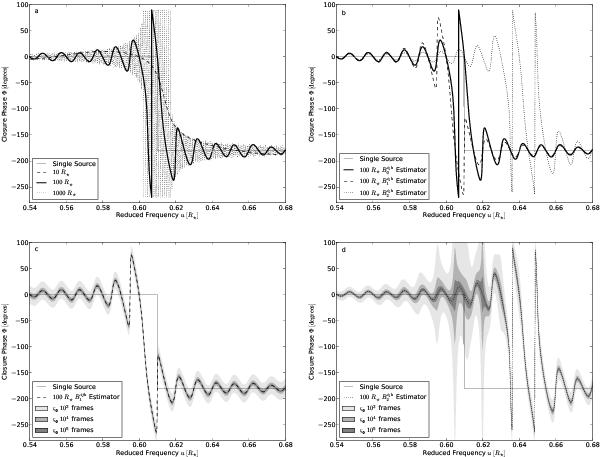
Demonstration of the effect of bias on a closure phase measurement. Plot
a): the closure phase trace resulting from a binary pair consisting of
a resolved primary of radius R⋆ and an
unresolved secondary with flux ratio r = 0.01 for separations
(s = 10 R⋆,100 R⋆,1000 R⋆).
Plot b): the closure phase trace for the
100 R⋆ system recovered by the
three estimators.  correctly returns the ideal closure
phase, whilst
correctly returns the ideal closure
phase, whilst  and
and
 do not. Both plots show the single
source closure phase signal (thin solid line) for reference. Plots c) and
d) show the closure phase calculated using
and
respectively as in plot b)
along with the statistical uncertainty on the measurement after 103,
104 and 105 frames.
do not. Both plots show the single
source closure phase signal (thin solid line) for reference. Plots c) and
d) show the closure phase calculated using
and
respectively as in plot b)
along with the statistical uncertainty on the measurement after 103,
104 and 105 frames.
Current usage metrics show cumulative count of Article Views (full-text article views including HTML views, PDF and ePub downloads, according to the available data) and Abstracts Views on Vision4Press platform.
Data correspond to usage on the plateform after 2015. The current usage metrics is available 48-96 hours after online publication and is updated daily on week days.
Initial download of the metrics may take a while.