Fig. 3
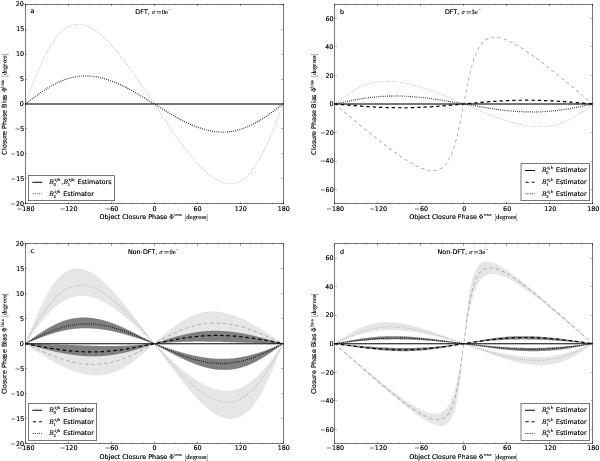
The bias in closure phase for  (solid line),
 (dashed line), and
 (dotted line) estimators under a
number of measurement conditions. Plots a) and b) show DFT
conditions, whilst plots c) and d) show non-DFT conditions
(described in the text). Read noise of
σp = 3e− is present in plots
b) and d). The thin and think lines show 120 and 300
photons reaching the detector respectively. The shaded regions in plots c)
and d) show the range of possible biases resulting from different
possible combinations of phases on the three baselines contributing to the source
closure phase.
(dotted line) estimators under a
number of measurement conditions. Plots a) and b) show DFT
conditions, whilst plots c) and d) show non-DFT conditions
(described in the text). Read noise of
σp = 3e− is present in plots
b) and d). The thin and think lines show 120 and 300
photons reaching the detector respectively. The shaded regions in plots c)
and d) show the range of possible biases resulting from different
possible combinations of phases on the three baselines contributing to the source
closure phase.
Current usage metrics show cumulative count of Article Views (full-text article views including HTML views, PDF and ePub downloads, according to the available data) and Abstracts Views on Vision4Press platform.
Data correspond to usage on the plateform after 2015. The current usage metrics is available 48-96 hours after online publication and is updated daily on week days.
Initial download of the metrics may take a while.