Fig. 3
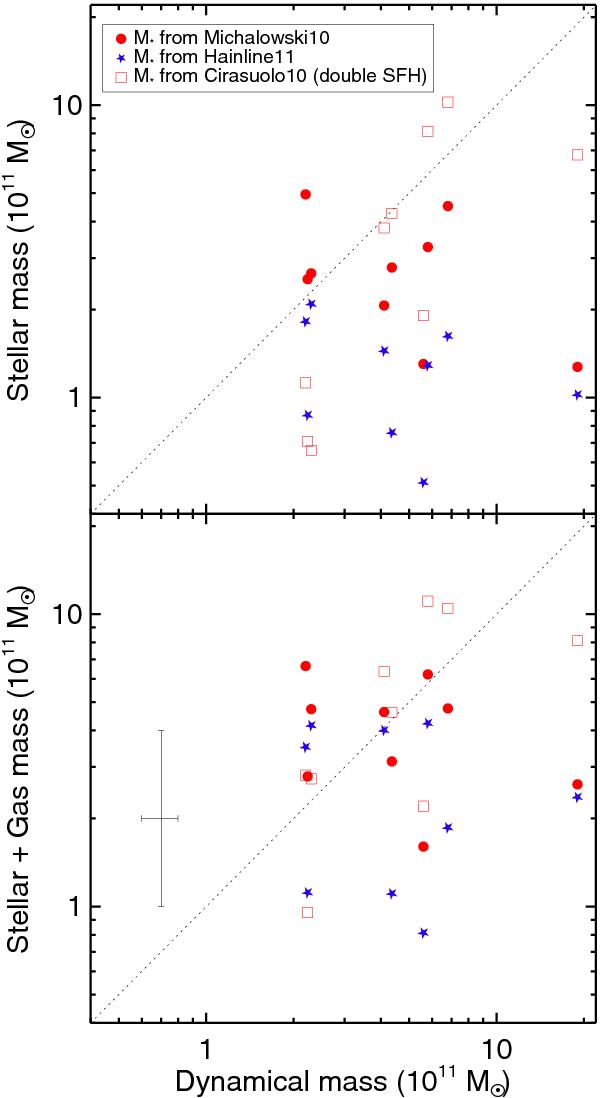
Stellar mass (M∗) versus dynamical mass (Mdyn) estimated from CO(1–0) (upper panel), and stellar+H2 gas mass (M∗ + Mgas) versus Mdyn (lower panel) for the 9 SMGs for which the necessary results have been compiled in Table 2. The data points derived from the stellar mass estimates of H11 are indicated by blue stars, those based on the stellar mass estimates of M10 are indicated by red circles, while the new double-component C10 values are indicated by red squares. In principle, only the area below the dotted line represents a consistent set of galaxy properties with Mgas + M∗ ≤ Mdyn, but because of the typical scatter (indicated by the error bars in the lower panel) and unknown inclinations, ≃2–3 out of the 9 individual SMGs are in fact expected to exceed this apparent threshold (see Sect. 3.1 for details). We see that, contrary to the conclusion of Engel et al. (2010), there is no evidence that the stellar masses derived by M10 using the Chabrier IMF are in conflict with the dynamical mass estimates, even allowing for estimates of the additional gas mass. Indeed, the average values of these ratios favour the M10 stellar mass estimates as the most consistent with the available data (see Sect. 3.1).
Current usage metrics show cumulative count of Article Views (full-text article views including HTML views, PDF and ePub downloads, according to the available data) and Abstracts Views on Vision4Press platform.
Data correspond to usage on the plateform after 2015. The current usage metrics is available 48-96 hours after online publication and is updated daily on week days.
Initial download of the metrics may take a while.