Fig. 2
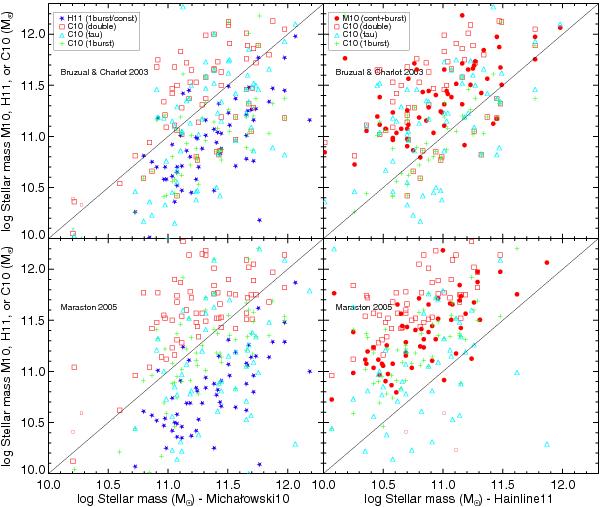
Comparison of the stellar masses of SMGs as derived by M10, H11 and in the present work using the stellar population synthesis models of Bruzual & Charlot (2003, and Maraston (2005, . The different symbols indicate the stellar masses derived by M10 (red circles), H11 (blue stars), and our new estimates based on the SED modelling method of Cirasuolo et al. (2010, C10 for three alternative forms of star formation history: double component model (red squares), exponentially declining tau model (light blue triangles) and single burst (green pluses). All the derived masses have been converted to the Chabrier (2003) IMF. Small symbols denote z < 0.5 SMGs. The M10 stellar masses are consistent with our new estimates for the double-component models, whereas the H11 stellar masses are consistent with single component models, and are on average a factor of ≃2.5 smaller than the double-component estimates (see Table 1).
Current usage metrics show cumulative count of Article Views (full-text article views including HTML views, PDF and ePub downloads, according to the available data) and Abstracts Views on Vision4Press platform.
Data correspond to usage on the plateform after 2015. The current usage metrics is available 48-96 hours after online publication and is updated daily on week days.
Initial download of the metrics may take a while.