Free Access
Fig. 4
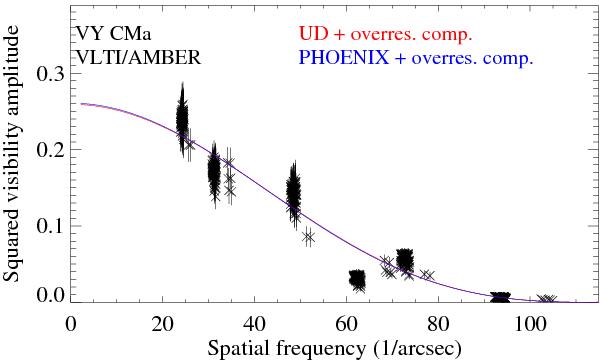
Squared visibility amplitudes of VY CMa as a function of spatial frequency obtained at the near-continuum bandpass at 2.20–2.25 μm. Also shown are fits of a UD (red) and a PHOENIX atmosphere model (blue). These contribute 50% to the total flux, and the remaining part is attributed to an over-resolved dust component.
Current usage metrics show cumulative count of Article Views (full-text article views including HTML views, PDF and ePub downloads, according to the available data) and Abstracts Views on Vision4Press platform.
Data correspond to usage on the plateform after 2015. The current usage metrics is available 48-96 hours after online publication and is updated daily on week days.
Initial download of the metrics may take a while.